Of Working Faraday Cages and 5G

About a month ago, I ran across this funny tweet about people buying Faraday Cages or mental router covers to block 5G:

I got really curious about what the Amazon reviews cumulatively looked like, so I did a small data collection of reviews from 33 different “Faraday cages” (and bags).

For folks who are unfamiliar with Faraday cages, these are encasings (typically of conductive mesh) which are used to block whatever is within the cage from electromagnetic fields. If put around a router, a Faraday cage would naturally block out all internet signal (and if it doesn’t, it wouldn’t actually be a Faraday cage). In other words, buying a Faraday cage to enclose your wireless router would defeat the purpose of having a wireless router.

Amazon Faraday Cages & Router Guards

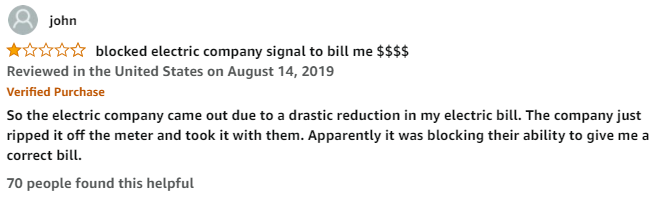
Though attention to Faraday cages and router guards on Amazon appears to be pretty recent, some of these things have been sold on Amazon for several years. Pre-2020 reviews show that people initially bought these wanted to cover smart meters, which are often installed by electricity suppliers.

More recently however, people have been purchasing these covers to block from 5G Routers. In fact, there has been a notable increase in the number of verified reviews about these products.

Throughout the time span, verified reviews of the products range greatly from folks who are convinced that using a router guard has deceased their headaches/improved sleeping to people complaining that the product has made using the internet impossible. One common feature of the positive verified reviews was an emphasis on how the guards would block elites (electric companies and governments) from “getting inside my brain.”

review_3.png

However, there were also reviews of folks complaining that their internet was no longer accessible.

Another big reason why some of the Faraday cages/bags were poorly reviewed was that they were too small for routers. This was an especially common critique when people wanted to use cages for smart meters to cover their router.

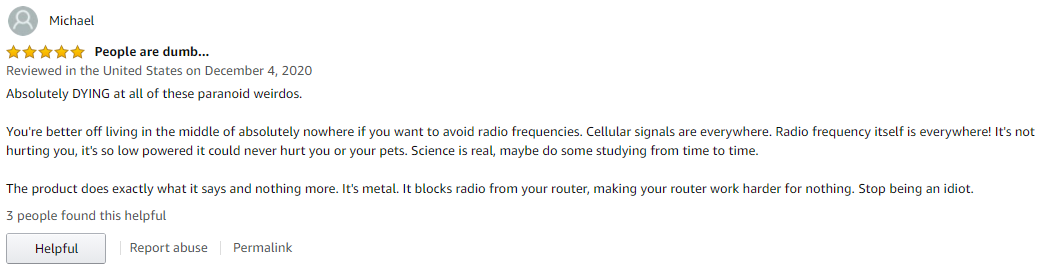
Unverified reviews typically took on two types of flavors: (1) mocking those who had genuinely bought the product or (2) corrective information that tried to explain why these products are basically pointless. Notably, since the December 2, 2020 tweet, the number of unverified reviews has grown considerably.

review_4.png
review_6.png

Unsurprisingly, the most common positive sentiment words (when using the Bing sentiment dictionary) focused on its ease of use and how it “worked perfectly” (this was said both sarcastically and genuinely). Negative words either focused on the “harmful” effects of electromagnetic fields (headaches, cancer, etc.) or criticized the cages for being a scam or joke.

Though the results were pretty unsurprising, this was a good exercise in playing around with Amazon reviews! Plus, with my first semester of teaching over, I’m hoping I can be a more active blogger.

The data and code for this analysis can be found on my github, here.

My Discbound Zettelkasten

My zettelkasten is the heart of my long-term notes. The German word “zettelkasten” literally translates into “slip box” (as in slips of paper). Built properly, it acts as a system of notes that you communicate with and, over time, learn from.

The premise is relatively simple: a zettelkasten is a collection of notes (think flash cards, but for comprehension and not rote memorization). Each note (or “zettel”) is a thought, bit of information, or concept. My zettels typically contain a keyword or phrase, some definition(s), relevant authors, and possibly causes/effects (antecedents and consequences of the concept).

Zettelkastens can be online and offline. In fact, I first learned about the zettelkasten system from Beck Tench, who uses a Zettelkasten via Tinderbox.

My zettelkasten is physical (surprise, surprise). For some time, I used regular index cards. However, when I switched to a discbound planner system early in 2019 (see my scheduling system here), I decided to also create a discbound zettelkasten. This allowed me to flip through my zettels and take them out to organize them in interesting ways.

 
An prototype of my zettelkasten. I took this picture while transitioning some of my old zettels into the final discbound zettelkasten.

An prototype of my zettelkasten. I took this picture while transitioning some of my old zettels into the final discbound zettelkasten.


Each zettel is a 4x3 index card, which is the size of the micro happy planner. I punch disc holes on one of the long sides of my zettels.

I keep my zettels in loose alphabetical order, so they’re relatively easy to find. I would discourage organizing one’s zettelkasten by topic or something because it may discourage unusual and surprising combinations of concepts (this is one way your zettelkasten “talks to you”).

Zettelkasten Key

Though I don’t formally organize my zettels (aside from alphabetically), I do ID each card with a unique alphanumeric sequence. Whenever I reference the zettel, I include the ID (both online and offline). My ID is a little complicated: the date of creation, followed by a field tag, a level of analysis, and a keyword. It typically looks something like this:

20191222CT0001word

20191222” is the date (2019-12-22). “CT stand for the field (Communication Theory). “0001” implies an individual-level idea. Finally, “word” is the keyword.


Understanding my identification system. This is the first page of my zettelkasten. The stickers and washi tape were gifted to me by fellow grad students in my department!


Identification systems do not need to be nearly as complex as mine, but they do need to help you produce unique identifiers. When I reference Zettel A in in Zettel B, I’ll write the ID of Zettel A into Zettel B.

Writing the Zettel

In addition to an ID, my zettel also includes:

  • The concept, usually a phrase or word. One zettel should be one “piece” of information. I also have dated zettels to refer to historical events (like the American Revolution, WWI, and the establishment of GATT.

  • A brief definition or explanation of the concept. Sometimes, I’ll reference other zettels.

  • On the back of my zettels, I have post-its referencing the other zettels (with the concept and the ID) and the names of relevant scholars or citations of relevant articles.

 
Front of Zettel

Front of Zettel

Back of Zettel

Back of Zettel


Combining Zettles

To write literature reviews, I take out my zettelkasten and combine multiple concepts in a “physical mind map” (If I like it enough, I’ll write it out as a cohesive flow chart and will digitize it).


One of the first times using my zettelkasten prototype. In the upper left corner, you can see the ways in which I combined the zettels to make a claim.


In this process, I often treat my zettels as nouns or verbs. Arrows are usually verbs or prepositions. I then use these zettels to create first drafts of my thesis statements (for short memos and articles, in particular).

Book Logging and The Zettelkasten

As I mentioned in my previous blog post, I use an open circle bullet (o) to indicate an idea I want to put into my zettelkasten. Sometimes, I want to write new zettels. Other times, I want to add to already-existing zettels. In the case of the latter, I’ll write that zettel’s ID in my notes, so my book is also “linked” to my zettelkasten.

When I add the information to my zettelkasten (either as a new zettel or when expanding on an already existing zettel), I fill in the circle. I try to scan my book log once a week to transfer concepts to my zettelkasten.

This process is great because it allows me to review my notes. When I want to add new notes, I use a different colored pen, so I know what my original comments were and what my newer comments were.

Book Logging

Over the past year, I’ve been experimenting with different ways to take notes on what I read (mainly books, research papers, and academic articles). While doing my coursework, my reading strategy was haphazard and very course-dependent. Sometimes, I would take notes in-line. Other times, I would write them down on post-its or loosely organized sheets. This worked well enough for individual projects… but it is unruly as a long-term collection of notes.

Since my preliminary exams, I’ve been using a dedicated reading journal, which I highly recommend (all the pictures I use in this post come from that reading journal).


An early entry of my book log, for Tomasello’s Becoming Human . I would write the page number on the far left side (highlighted by different chapters), and then the notes to the right. Sometimes, I’d include notes in different colors or post-it’s if I wanted to move concepts around.


At the beginning of my book is an Index, which lists the books or articles that I have reading, and the page I begin my notes for that book or set of articles.


My Book Index, with some notes (in red).


Since last month, I’ve started using the book log strategy from the Bullet Journal site. I’m a fan of bullet journaling in general, and the original bullet journal method is great for those looking for a planner/to-do list/organization system (you can learn about the bullet journal rapid logging system here, and I highly recommend the 5-minute video tutorial here).

This system is originally made for books, but you can also use this system for journal articles you read in class or for a project.

What makes the book log system unique?

  1. Chapter Index: Reading notes begin with a chapter index. This is usually the table of contents for a book. If I were reading articles for a class or research project, I would list all the articles here. I was somewhat irked with the time it took to write down all the chapters, but it has been absolutely worth it when I come back to old notes.

  2. “Treading”: When I take notes and want to point to a specific part of the book, I write the page, paragraph, and line number down. (This is not quite the same as bullet journal threading, but it has a similar principle). As the blog post recommends, you can use a “^” arrow to indicate “same as previous” (like an “ibid.”).

  3. Different bullets: Like rapid logging, the book log system several different “bullets” to indicate different types of notes and tasks. The ones they recommend are dashes for regular notes (this is the most common bullet for me), a quote for quotes, and a dot for tasks.

- dashes

“ quotes

  • tasks

I added two (well, three) more to this list:

= for combining ideas

? for questions (I haven’t used this, but I imagine it would be useful in class or guided reading)

o     I use an open circle for incomplete tasks. I fill it in when the task is complete*

(* the only tasks I really have in my book log, however, is to add to my zettelkasten.)

These six “bullets” collectively constitute my key.

 
Book Logging Key

Book Logging Key


How do I use this system?

I begin by writing out my chapter index. Though the book log system recommends writing the chapter in as you read it, I actually wrote down all the chapters I was interested in at the beginning. When I take notes for a chapter, I write the first page of those notes on the far right.


Some notes I took from my first attempt using a book log, while reading a research paper about Foxconn and targeted economic development (Mitchell et al., 2019).


Underneath the chapter index, I will have space to write some main points from the book. This typically includes a “purpose statement”: one sentence about why the author wrote the book or what the author hopes to accomplish with the book.

When I read a chapter, I write “CHAPTER #” and then take notes below that. I do my threading on the far right of the page (at the minimum, I usually write the page number). All my threads are highlighted so I can find them easily.

What if I’m reading a couple of articles?

I haven’t used this method as much for reading articles, but I imagine it would still be useful. I did read a set of articles about North Korea, and I found it was useful to read related pieces in 4-5 article batches. In this case, I treated each article as a “chapter.” I wrote an article index, with the “key points” section beneath. Like chapters, some articles are more or less useful than others. I also use the citation shorthand (AUTHOR, DATE) instead of the chapter number. I thread similarly, but I add a column number (page, column/paragraph, line).

For seminars, I would recommend treating each class session as a batch.

What do I take notes on?

Before I started using the book log system, but after I started taking notes in a book, I was asked to do a presentation on organizing your notes. One student had asked me “how do you know what to take notes on, instead of writing everything down?”

At the time, I gave a very lackluster answer: I followed my gut. I’ve been frustrated with that response ever since, which got me thinking about my note-taking process. And, of course, when I think, I read. Andrew Abbott’s book Digital Papers had a great chapter on Reading (Chapter 7). He describes several “modes of reading”: (1) narrative reading, (2) meditative reading, (3) scan reading, (4) mastery of argument reading, (5) party mastery readings.

This typology is great for thinking about what information you want to extract from reading—and what notes you want to take. I use my book log for meditative reading and when I am trying to understand (or “master”) the core argument of someone’s book or article. For this reason, having a “purpose” or “key points” section below my chapter index is really useful, and keeps my focus on the goal (comprehension).

In books, the first few chapters tend to be the most theory-laden, with the subsequent chapters or parts focusing on proof (either statistical, qualitative, case-based, or some combination thereof). I spend a lot of time on these earlier chapters and tend to write the most notes for them.

Going beyond the book

One of the things I’ve struggled with the most is how I translate notes in my book into a broader collection of “ideas” between multiple books. One of the ways that I do so is my combination bullet (=), which I use if what I’m reading reminds me of another author. These notes help me connect multiple authors or concepts in-the-moment; in other words, it’s great short-term.


Some notes I took while re-reading Jeffrey Alexander’s The Civil Sphere. While reading, I connected some thoughts between Alexander and Parsons. You’ll also see that I wrote a quote down verbatim from chapter 3.


For the long-term, I rely on my zettelkasten, which I’m hoping to talk about in my next blog post.

Research Pipeline: Tracking Your Papers

One of the most important things you have to do as an academic is keep track of your projects—and, by extension, your papers. Like many researchers, I get interested in a lot of projects and (dare I say it) I tend to over-commit (*unsurprised gasp*). But keeping track of my projects helps me be realistic about what I can accomplish and what I have on my plate.

The most common way to track your projects is to use a “research pipeline” (also known as a publication pipeline). This metaphor is extremely useful: between when you conceptualize the project to when you publish the paper is a whole mess of steps including (but not limited to): data collection, data analysis, writing the paper, and revisions (and revisions, and revisions, and revisions). By breaking up your project into steps that build on each other, it makes producing research and writing up your results more manageable.

These steps are not always linear. When you receive a revise and resubmit a full paper, reviewers may ask you to redo a part of the analysis. The manuscript itself may even go through several complete rewrites before it is accepted to a journal. And book projects may have entirely different pipelines.

A simplified “rule of thumb” for your publication pipeline is the 2-2-2 (two in development, two in data analysis, and two under review; though I’ve seen variants with different 2’s).

However, as many articles have pointed out, there are lots of intermediary steps that should be recognized. Suggestions range from anywhere between seven and eleven (or more). My pipeline has 9 steps.

In 2019, these were my steps: (1) literature/planning, (2) collect data, (3) compile data, (4) data analysis, (5) draft paper, (6) full paper, (7) conference/under review, (8) R&R, (9) accepted!

In 2020, I modified my steps slightly: (1) idea nursery, (2) data plan/IRB, (3) data collection, (4) data analysis, (5) draft paper, (6) near completion, (7) under review, (8) R&R, (9) accepted!

The main changes are in the first half of the pipeline. I expanded out my “literature/planning” step into two steps: the idea nursery (which I read a lot of literature to understand the question’s domain) and the data planning (where I think about what data layers and analyses I need to answer the research question I’m interested in). The data planning is critical for me: different projects demand different types of data plans. Survey experiments and semi-structured interviews, for example, must go through IRB approval. In projects relying on a large text dataset, I have to think about how I want to construct my corpus.

After this, my steps are fairly consistent: collect the data (i.e., execute the data plan), analyze the data, draft the manuscript, complete the manuscript (“near completion” was a better descriptor for me than “full paper”), submit the paper to a publication (or conference), receive and complete an R&R (if submitting to a publication), and getting the paper accepted. When a paper under review is rejected, I move it back to the “near completion” stage (or earlier if I need to do more).

For projects that I want to shelf, I treat the back of my page as a literal “shelf.” In 2020, I split my shelf into a “short term shelf” (things that I want to pick back up within the year) and a “long term shelf” (things that I want to go back to, but probably not for some time).

How do I keep track of the pipeline?

I’ve used a variety of different strategies to try and keep track of my papers. First, I used to list them all on a sheet of paper and cross out the paper when it had been accepted. This was a good first step, but it didn’t really help me understand the stage my paper was on.

Now, I use a physical pipeline with post-it notes. I got inspiration from this bullet journal spread, which uses a similar strategy (there are 12 steps in this pipeline). The original spread has a color-coded system (green for dissertation, orange for side projects, and yellow for postdocs), but I am more haphazard.


My 2019 Pipeline! Thanks for helping me keep track of this year’s papers!

Moving my post-it’s to my 2020 pipeline!


May of my projects turn into multiple papers. For each project, I have a 2-6 letter key (“SP” or “Debate” or MCRC”). Papers are indicated with an additional word. For example, my paper on Russian IRA disinformation in the news was “SP News”. My paper on cross-platform Russian disinformation was “SP 3media”.

Each paper is indicated with a post-it note. I like to keep track of papers rather than projects because my projects are prone to branching into multiple papers. When I complete a step, I move the post-it for that paper to the next stage. However, I can also go backward: when I have to redo some analysis for a paper, I move my post-it from “Under Review” back into “Data Analysis” (or even “Data Collection”).

When a paper is accepted, I write the paper down in my last box (“Accepted!”) and throw away the post-it note for that paper. I like the permeance of writing the accepted/in-press/published paper down. I’ll also put a little exclamation mark for accepted papers that are single-authored or first-authored.

In conclusion: tracking your research/publication pipeline is really useful for understanding what stage your project is at. I encourage reviewing your pipeline at least once a month and updating the pipeline yearly (especially if you’re still trying to figure out the most optimal steps in your pipeline… which may change as your research interests change).

Disney Plus Data and Chill ;)

On December 12, 2019, Disney unveiled its streaming service, Disney+, to the world. It received significant attention, both good and back, from the press—which makes sense, because over 10 million people signed up in the first day.

Twitter was also abuzz with conversations about Disney+ (see this string-of-tweet “news story” about Twitter activity on the first day). Several pointed out that shows, including new ones like The Mandalorian and oldies like Darkwing Duck, were trending soon after Disney+ was launched.

But what would activity look like after the first day?

To answer this question, I used Mike Kearney’s rtweet package to look at tweets posted from 11/14/19 to 11/18/19 that had one of the following keywords: disneyplus, disney plus, disney+, and disney +.

Timeline

As with any long-term (> 1 day) popular topic (like elections), tweets about Disney+ had a natural seasonality. People tweet less after midnight and pick back up at 6 or 7 a.m. the next day. While activity was still pretty high on the 14th, people tweeted less and less about it over time (as would be expected). There was a little over a million tweets in the corpus (n = 1,107,413).

Topic Modeling

I also ran an LDA topic modeling, which highlights the variety of conversations on Twitter about Disney +.

Noticeably, The Mandalorian, Hannah Montana, the Simpsons (which is on Disney+ in its original 4:3 format), and Bad Girls Club were talked about frequently enough to be (mostly) stand-alone topics. The Mandalorian hashtag (#themandalorian) was also a popular keyword in the corpus.

But we also see a variety of other topics, including one about the Nickelodeon and Netflix deal (which many people viewed as a response to Disney+’s explosive popularity) and another comparing Disney+ to other streaming services (like Netflix, Hulu, and HBO). In fact, Netflix was the third most frequent term in the dataset (behind Disney and Disneyplus).

(Some of the topics were obviously noisier than others. Topics with the little red “n” are “noisier” than the others, meaning that a large number of tweets with a high beta in that topic were not related to the topic labels. Many tweets in the “Bad Girls Club” topic, for example, don’t actually have to do with that show.)

Sentiment-Laden Words

I did a quick sentiment analysis as well, using the tidytext package (specifically, the bing sentiment lexicon). This allowed me to look at frequently used, sentiment-laden terms.

tweet_sentiment.png

As with any sentiment analysis that is based on a lexicon, there are obvious limitations. The bing dictionary, for example, includes “trump” as a positive word, but it would count any mention of Donald “Trump” as well.

We can see a similar phenomenon here with the word “chill”, which Bing treats as a negative word. If you recall from the topic modeling results, “Disney+ and Chill” was a topic in-it-of-itself. In addition to using the specific phrase “Disney+ & Chill” (which is a snowclone from “Netflix & Chill”), we see people trying to come up with their own variants, including “Disney+ and Thrust” and “Disney+ and Bust”.

For a quick and dirty analysis, this was a pretty fun corpus of tweets to go through! You can check out my code at my Github.

The Hidden Conference Cost of doing Interdisciplinary Work

Hello blog!

Long time no chat. May was entirely lost in the black hole that is the end of the semester and the start of “academic conferencing.” In the past month, I attended the International Communication Association’s conference (ICA 2019; what I would consider the “main” conference of my primary field, Mass Communication) and a workshop at the the North American Chapter of the Association for Computational Linguistics conference (NAACL NLP+CSS 2019). I have a nice break through the remainder of June and July, and then in August I have one more conference (Association in Education for Journalism and Mass Communication, AEJMC 2019).

Which brings me to my topic of the day: the cost of attending conferences to stay up to date on interdisciplinary scholarship.

Realistically, I work in three intersecting fields (four, if you include my computational stuff separately): Mass Communication, Political Science, and Linguistics. Removing a component of the trifecta is not possible; it would mean fundamentally misunderstanding my research agenda.

There are a lot of benefits and problems to doing interdisciplinary research, which many other scholars have spoken on. I love interdisciplinary work, personally, because that’s where all the enjoyable little questions are. And, as valuable as specialization can be, most research questions can be studied in many ways, depending on the department/discipline you end up in. A question about political language may produce different results if studied in Sociology, Psychology, and Political Science. So, to me, the rigorous thing would be to do interdisciplinary research—to be specific in your question, broad in where you look for theory, and concrete in your study’s operationalization and methodology.

But there are substantial professional costs to doing interdisciplinary work. A Google Scholar search of “interdisciplinary research difficulties” will yield more than enough articles to give you a sense of how much the academy has struggled to deal with interdisciplinary scholars (I choose the word “deal” carefully… rarely do I feel as if the academy “supports” interdisciplinary work).

One of those weirdly silent struggles is the cost of attending oh-so-many conferences. In an ideal world, I’d like to submit to conferences for all the fields I participate in (ICA/AEJMC for Mass Comm, LSA for Linguistics, APSA/MPSA for Political Science, NAACL/CoLing for Computational Linguistics). There conferences are important for many reasons. They help you connect with others to find jobs (a super important thing for any graduate student), they expose you to the latest studies and results in the field, and they help you connect with other people who are doing similar work to you.

But each conference can cost a substantial amount of money to attend. Below are the registration cost of the seven conferences I noted above, and a few others:

Conference 2019 Location Regular Reg Student Reg
AEJMC Toronto $ 215 $ 125
APSA Washington D.C. $ 160 $ 125
CoLing Santa Fe $ 715 $ 500
ICA Washington D.C. $ 300* $ 165
IC2S2 Amsterdam 345 € 195 €
ICCSS Amsterdam 450 € 350 €
LSA NYC $ 86 $ 90
NAACL Minneapolis $ 595 $ 295

(* ICA has tiered prices depending on where your institution is located. These are U.S. prices, Tier A.)

For each conference, you also need to account for hotel and airfare, at minimum. The best conferences are the ones that are proximity close (the location of NAACL, in Minneapolis, was a huge reason why I submitted a paper to begin with), but you are typically looking at between 300 and 500 dollars for a round-trip flight to somewhere-in-the-U.S. (aka: Chicago or DC). Conference hotels usually charge between 175 and 250 per night (graduate students bring down the cost substantially by staying with other graduate students). If you are a lucky young scholar like I am, you will have tt professors who will assist with food and drink for a good portion of the trip, but this is obviously not always the case.

All in all, you can be spending somewhere between 500 and 1000 dollars for each conference you attend. This cost increases considerably for non-(U.S. and European) scholars, who have to not only fly in from another country ($$$ international flights anyone?!) but also apply for visas, an increasingly daunting task (most of my conferences are in the U.S., which makes me double-privileged as a scholar in the States).

If you’re a scholar working in two disciplines, that’s twice the conferences you may need to pay for. Or, you’ll have to sacrifice attending certain conferences in one year to attend another. For a young scholar, particularly one doing interdisciplinary research, not attending a conference means missed opportunities to meet people, connect about research, and find future avenues of collaboration.

Given this, we need to start thinking about the conference model, and how that limits young scholars who cannot normally afford to attend so many conferences. Alternative ways to participate, cheaper locations (and cheaper hotels), and having more included in a registration can go a long way.

Yesterday, I was a footnote in history!

Yesterday, I received exciting news! A piece that I had written with Chris Wells for Columbia Journalism Review was cited in the Mueller Report, which was released a day ago.

The piece that we wrote for CJR focused on news organizations that embedded tweets by Internet Research Agency (IRA) handles into their news stories. We’ve increased the number of outlets analyzed since the CJR piece (it was about 40 when we started, but over 100 now), and our finding still holds: a majority of news organizations cited an IRA account in at least one story.

Contrary to popular opinion, these IRA accounts were not sharing “fake news” (as in: false information). Instead, IRA tweets were often quoted for their salient, often hyper-partisan opinions. For example, one tweet advocated for a Heterosexual Pride Day as a way of inciting LGBTQ activists. Another called refugees, “rapefugees”. These accounts would often portray themselves as American people (e.g., @JennAbrams portrayed herself as a “typical” American girl, as shown by research done by my colleague Yiping Xia), or as groups (like @ten_gop, an IRA account pretending to be Tennessee GOP members, and @blacktivist, an IRA account pretending to be BlackLivesMatter organizers).

This has important implications, and speaks to Muller’s earlier indictment of the IRA, which noted that Russia’s campaign goal was “spread[ing] distrust towards the candidates and the political system in general” (p. 6). Ironically, the discovery of the IRA campaign in the summer/fall of 2017 probably fed into this distrust (especially since news organization were as likely to be “duped” as American citizens).

The (underacted) part where we are referenced focuses on this specific issue—journalists embedded these tweets thinking they reflected the opinions of U.S. citizens. This is incredibly problematic, and something that both academics and journalists want to find solutions for. Following our publication in early of 2018, several news organizations reached out to us regarding the specific articles i which they had unintentionally quoted IRA tweets. The research team was particularly excited by these exchanges because it shows that journalists care, and want to avoid doing this in the future.

Tweets about WI Gubernatorial Race Part I: October 28 to Nov 6

Politically, Wisconsin is quite different from my home state of New York. It’s long been considered a purple, or swing, state. For that reason, Wisconsin has often received extra national attention when it comes to local or state-wide politics.

The 2018 Midterm Elections were another example of this, with many citizens around the country tracking Governor Scott Walker’s race against Superintendent Tony Evers. Today, I explore how Twitter talked about this race in the week leading up to Election night (October 28 to Nov 7). This post will focus on the lead-up to the election. Part II will focus on the last few hours of the election (12:30 to 2:30 on November 7, 2018).

(Note: Tweets were collected using the r package rtweets. All datetimes have been converted to CST. For more information about this collection and analysis, please scroll to the bottom)

A broad temporal view: Oct 28 to Nov 6

In the week leading up to the election, there were several noteworthy spikes. We focus on two in particular: November 1 (8-9pm) and November 4 (7pm).

November 1, 2018 from 8:00-9:59 pm

This was the largest spike for Walker in this week (1568 tweets in two hours). Far and away, the most common verb used was variants of “call” (e.g., “called”/”calls”/”calling”). This is because, that day, Governor Walker said that President Obama was "the biggest liar of the world.” This language (employed by non-journalists and journalists alike) was also employed in leads of news stories in Fox News and The Hill).

November 4, 2018 from 7:00-7:59 PM

Although this peak was not as prominent as the others explored here, it is one of the few times that Evers exceeded Walker in references on Twitter.

Many of these tweets appeared to be campaign-oriented tweets about Evers’ support for Wisconsin residents. Unlike the previous spike, there did not seem to be an event aligned with this moment in time. This suggests that this spike was campaign-induced, rather than naturally generated.

A closer look at Election Day

As can be seen in the above image, attention to the Walker/Evers election peaked after 12:00 AM CST, late in the night relative to other well-watched races that day. Votes rolled in minute by minute, with many outlets (including NYT, one of my main trackers) showing a less than 1% margin for several hours.

Methodology

Tweets were collected using Mike Kearney’s rtweets. I began my search at 2:40 AM CST on November 7, 2018, using the search terms “Scott Walker” OR “Tony Evers” OR “#wipolitics” OR “#wielection“. Twitter’s REST API provides an about 1% random sample of tweets. This yielded about 111,000 tweets.

Tweets were annotated for their part-of-speech and dependency using coreNLP. Within the corpus, there were over three million dependencies.

Time Series of IRA Activity on U.S. Social Media Platforms

So I've been toying around with some of the data on other social media platforms, now that much of it has been made publicly available. I'm looking forward to doing a more systematic analysis of the content. In the meantime, however, here are some counts of IRA activities on different social media platforms from 2015 to 2017. 

I was somewhat surprised to see that the time series did not line up as neatly as I thought they would have. Perhaps these strategies are meant to complement each other? This is where a deeper dive into the content or the account would be more useful. For example, perhaps conservative-imitating IRA accounts (e.g., Twitter's @TEN_GOP) responded to different things compared to liberal imitating IRA accounts (e.g., Facebook/Twitter's @Blacktivist group). 

Given the pending lockdown of information regarding this case, it is more important than ever to share and verify this information. It's a shame researcher do not get much access to this kind of data, as scientific rigor should be the minimum standard for analyzing potential foreign influences into American elections. 

Reddit Data Source: [Link]
Facebook Data Source: [Link]

Advertisements purchased by IRA on Facebook

Submissions to Reddit by IRA-controlled accounts

Tweets written by the IRA

Understanding a little more about recent coverage of Korean-U.S. relations through adjective use

Yesterday, U.S. President Trump pulled out of a "highly-anticipated" summit meeting with North Korea's Kim-Jung Un. Given the freshness of this story, it'll take some time collect enough articles to do an anlaysis of this specific incident. But, in the meantime, some interesting results from my analysis of Korean-U.S. relations in American news below.

(Data cleaned and analyzed using R tidytext, quanteda, and OpenNLP. Graphs produced by ggplot2 or MediaCloud.)

Count of articles using the words "Trump" and "North Korea" in top American news media (digital + traditional). Results gathered using MediaCloud archive.

Count of articles using the words "Trump" and "North Korea" in top American news media (digital + traditional). Results gathered using MediaCloud archive.

As we can see above, the majority of the coverage appeared to be between May 7 (when North Korea claimed to have demolished a nuclear test site) and May 21. Using those two weeks as my window, I pulled all articles referencing "Trump" and "North Korea" from four news outlets: CNN (n =96), Fox (n = 114), the New York Times (n = 89) and the Washington Post (208), a total of 507 news stories.

I tagged all the words in the news stories for their part of speech using OpenNLP. I then pulled out all the adjectives, removed duplicates, and screened them for accuracy (OpenNLP has an above 90% accuracy, but the human eye is critical to ensuring quality results). I finally looked at the use of these adjectives in relation to specific actors/parties (mainly North Korea, South Korea, and the United States). Given the effect of political personalization, I consider both the country name and the name of the leader (e.g., "North Korea" OR "Moon Jae-In" OR "President Moon" OR "Moon Jae In") as keywords. I retained the adjective if it appeared within three words of the NK, SK, or US keywords.

Raw counts are presented below (keep in mind the corpus is not perfectly balanced... also, sorry I was too lazy to reorder the charts XD Just so tired and wanted to practice some code):

Most commonly used adjectives related to Trump/U.S.


Most commonly used adjectives related to Kim Jung-Un and North Korea


Most commonly used adjectives related to President Moon and South Korea